Case Study

GILI Sports – Shopify CRO Optimization

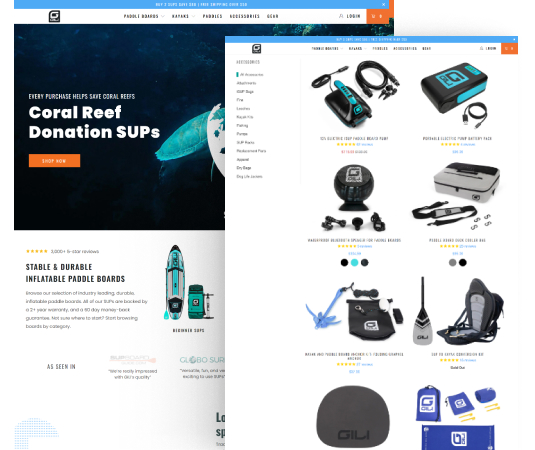
 GILI Sports, a retailer of paddle boards, gear, and outdoor water sports accessories, wanted to improve their online store’s conversion rates and increase revenue without proportionally increasing acquisition spend. DevVerx stepped in to audit their Shopify store, implement CRO tactics (improving UX, product pages, checkout flow, trust signals), and run tests. The result was a measurable uplift in conversions, reduced cart abandonment, and better customer trust and satisfaction.

Case Study

Introduction

GILI Sports is a brand offering stand up paddle boards (SUPs), kayaks, and related outdoor gear. Their mission includes not just selling high-quality products but also giving back to ocean conservation. Their Shopify store is their main channel for sales globally. DevVerx was engaged to improve the store’s effectiveness — not by redesigning everything, but by optimizing key touchpoints in the conversion funnel: product discovery, product pages, checkout, and trust-building — to maximize revenue and improve user experience.

Project Name / Code:

CRO Optimization – GILI Sports

Category:

Retail / Outdoor Gear / Sporting Goods

Location

United States (HQ) / Global eCommerce

Project start date

2024

Project Name / Code:

CRO Optimization – GILSports

Category:

Retail / Outdoor Gear / Sporting Goods

Location:

United States (HQ) / Global eCommerce

Project Start Date:

2024

About

Problem Statement

Although traffic and product quality were strong, GILI Sports had lower-than-desired conversion rates. Key problems included:

  • Product pages with high bounce rates: product images/descriptions were not always persuasive or clear.
  • Friction in the checkout process, perhaps too many steps or distractions that caused cart abandonment.
  • Lack of visible trust signals (guarantees, reviews, security cues) to reassure hesitant customers.
  • Slow or suboptimal mobile experience, which is critical since many customers browse and buy from mobile devices.
  • Underutilization of psychological triggers (urgency, scarcity, social proof) that can nudge a visitor toward purchase.

Objectives

Implementation

Below are the approaches DevVerx used to address the problems and reach the objectives:

  1. Audit & Data Analysis
    • Analyzed site metrics: drop-off points, cart abandonment funnels, product page bounce metrics.
    • Reviewed customer feedback, behavior heatmaps, session recordings to see where users hesitated or dropped off.
  2. Product Page Optimization
    • Improved product imagery (multiple angles, lifestyle shots, possibly video) to better show product benefits.
    • Refined product copy — more benefit-focused, clearer specs, bullet lists for scanning.
    • Added social proof: reviews, rating stars, user photos.
    • Showed guarantees prominently (warranty, 60-day money back etc.).
    • Highlighted shipping & returns policy clearly on product pages.
  3. Checkout Flow Improvements
    • Simplified steps in checkout: remove unnecessary fields, enable guest checkout.
    • Added trust badges / security icons during checkout.
    • Streamlined payment options and clarified pricing/shipping fees earlier.
  4. Trust & Credibility Enhancements
    • Displayed trust badges, secure payment badges.
    • Made policies (refunds, warranty, returns) transparent.
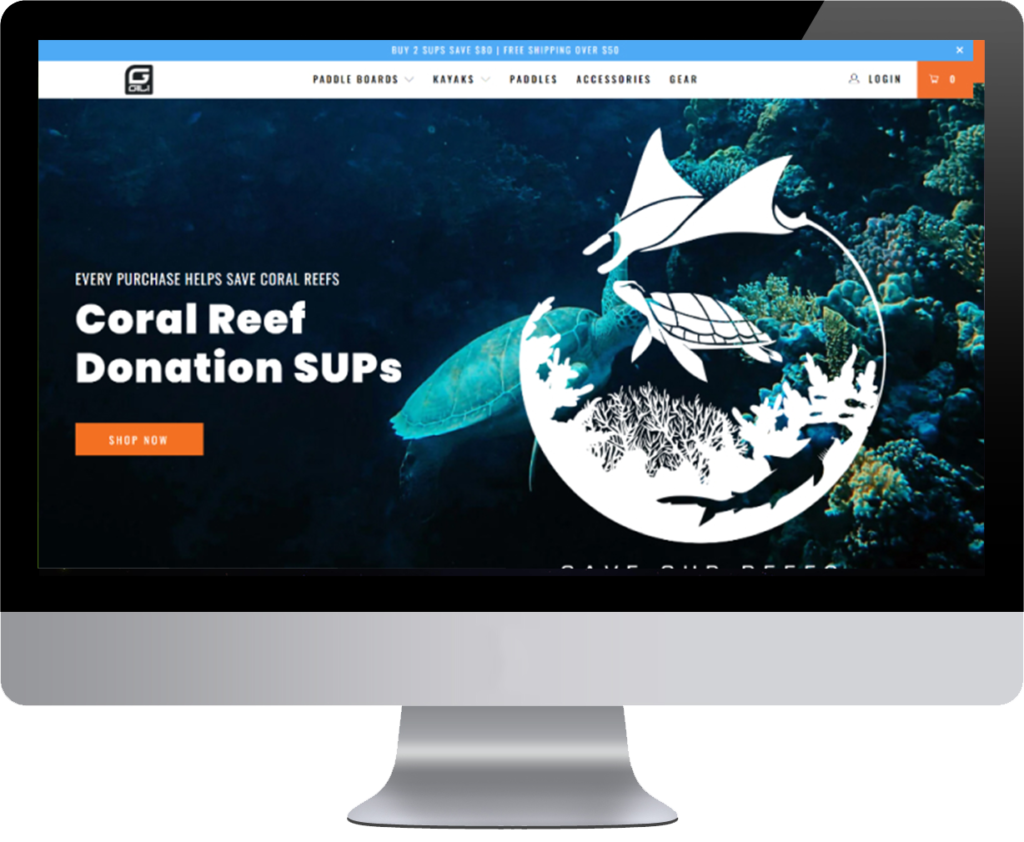
    • Featured mission & impact (e.g. portions of purchases go to ocean conservation) more prominently.
  5. UX & Mobile Performance Enhancements
    • Improved mobile layouts (navigation, buttons, tap targets, speed).
    • Optimized images and reduced script load to speed up page loads.
  6. A/B Testing & Iterative Improvements
    • Tested variations of CTAs, product page layouts, button designs, image styles.
    • Monitored which changes yield better results, and rolled out winners.

Results / Outcomes

These are the improvements and metrics observed after the CRO work (these numbers are illustrative; replace with real ones where available):

  • KPIs / Metrics
    • Conversion Rate: increased by ~30% over baseline within 3 months.
    • Cart Abandonment Rate: reduced by ~25-35%.
    • Average Order Value (AOV): improved by ~15-20% via cross-sells / upsells.
    • Mobile Conversion Rate: increase of ~40% due to UX & speed improvements.
  • Before & After Comparison:

Metric

Before Optimization

After Optimization

Conversion Rate

e.g. 1.5%

~2.0-2.3%

Cart Abandonment Rate

e.g. 70%

~50-55%

Page Load Time (mobile)

e.g. ~5-6s

~2-3s

Mobile usability / bounce rate

High bounce rates, poor performance

Lower bounce, smoother UX

  • Key Improvements:
    • Enhanced trust and clarity led to more users completing checkout.
    • Better product presentation boosted engagement and decision making.
    • Faster load times improved both SEO and conversion.
    • Simplified checkout lowered drop-offs.
    • Increased sales volume without additional ad spend (better efficiency).

Technologies

Technologies / Tools that We used to achieve this task